How to Vary the Built-in Line Chart Markers

On first inspection the shapes of the built in line markers appear to be very limited.
But by adjusting the foreground and background colours you can reveal some extra markers.
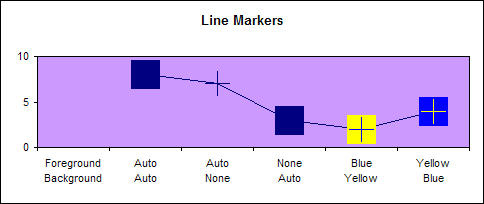
The following screen shots are taken from the Patterns tab of the Format Data Series dialog. To display it just double click your data series.
Foreground and Background set to Automatic colour
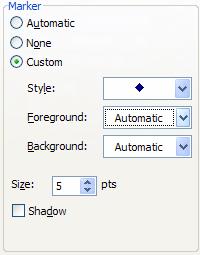

Foreground Automatic and Background No Color
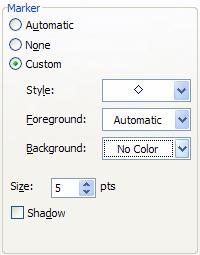

This combination reveals a selection of crosses.
Foreground No Color and Background Automatic
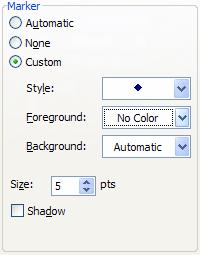

This combination reduces the size of some markers to the extent that the line ones are lost.
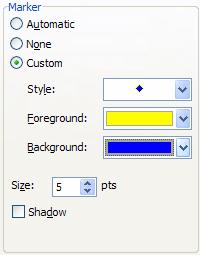
Foreground and Background Coloured
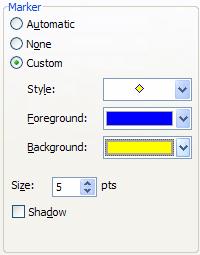

Using 2 different colours allows the crosses to appear with a coloured background

This explains how to get the most from the built-in markers. But it is possible to use your own shapes and pictures as custom markers. Here is a quick explanation. In order to use an Autoshape as a custom marker simply select the autoshape and press CTRL+C to copy it to the clipboard. Select the markers of the series in your chart and press CTRL+V to paste the shape.

